Investment casting produces parts with surface finishes ranging from 63 to 125 Ra microinches (1.6 to 3.2 micrometers). This smooth finish comes directly from the casting process without additional machining. The ceramic shell mold creates a fine surface texture that accurately reproduces the wax pattern’s details.

| Casting Process | Typical Ra (μm) | Typical Ra (μin) | Characteristics & Limitations |
|---|---|---|---|
| Sand Casting | 12.5 – 25 | 500 – 1000 | Rough finish, suitable for large parts, low tooling cost. Requires significant machining for smooth surfaces. |
| Investment Casting | 1.6 – 3.2 | 63 – 125 | Excellent finish, high complexity, near-net-shape. Compatible with virtually all alloys, including high-temp superalloys. |
| Die Casting | 0.8 – 1.6 | 32 – 64 | Superior finish, high production rates, excellent for thin walls. Limited to lower melting point, non-ferrous alloys. |
The metal casting’s surface directly mirrors the wax pattern and mold cavity. A smooth, high-quality wax pattern (often made by injecting wax into a polished aluminum die) yields a smoother casting. Any texture or blemish on the wax will reproduce on the metal.
The ceramic shell’s first coat, called the prime coat, creates the casting’s surface finish. This coat uses fine refractory particles between 200 to 325 mesh size.
Coarse stucco or large grains in backup shell layers can imprint a slight texture (“sandpaper” effect) on the casting. Typically, investment casting uses very fine silica or zircon flour in the primary coat to minimize roughness.
Shell thickness typically ranges from 0.25 to 0.5 inches, built up through 5 to 12 coating layers. Thinner shells produce better surface finishes but risk cracking during metal pouring.
A controlled dewax (often via autoclave or flash-fire) prevents shell cracking or rough spots. Dewaxing removes the wax pattern using steam autoclaves at 250°F to 350°F or flash firing at 1,400°F to 1,800°F.
Firing the shell to sinter it (e.g. ~800–1100 °C) hardens and smooths the interior surface before pouring, improving the surface quality of the casting cavity.
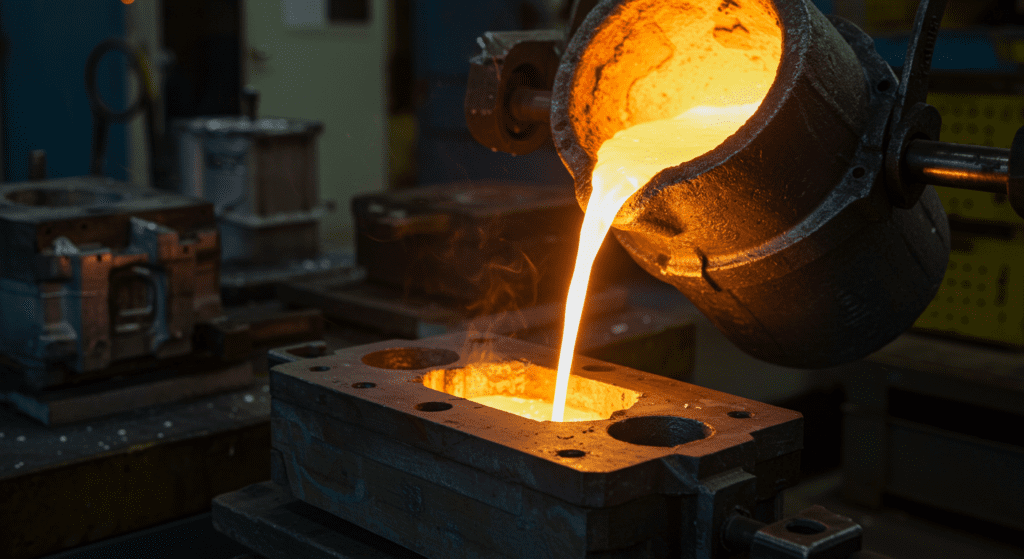
Pouring metal into a sufficiently heated shell helps the metal fill fine features without premature freezing.
Too low a pour temperature or inadequate mold preheat can lead to incomplete filling or ripples. Conversely, excessive superheat or very high pour temps for certain alloys might erode the mold surface or cause reactions that increase roughness.
Controlled pouring speed (to avoid turbulence) and proper venting also prevent defects like inclusions or air pockets that could mar the surface.
Some metals react with the ceramic more than others.
For example, steels form oxides (e.g. a chromium oxide skin in stainless steel) during pouring that can slightly imprint on the surface. Highly reactive or high-temperature alloys (nickel superalloys, cobalt alloys) may require special face coat materials (zircon, alumina, etc.) to prevent chemical attack on the mold that would roughen the casting.
In general, alloys that solidify with finer microstructure (and less shrinkage defects) will have smoother surfaces.
While the values discussed are for “as-cast” surfaces, investment castings often undergo minor finishing like knockout of the shell, shot blasting, or pickling. These steps can slightly alter surface roughness.
Light grit blasting with fine media can reduce Ra by removing adhered ceramic or oxide scale (often bringing roughness down into ~Ra 0.8–1.2 μm range). Chemical treatments (acid pickling, etc.) can also improve Ra modestly by etching away oxides – e.g. pickling might improve a ~1.5 μm surface to ~1.0 μm Ra.
| Alloy Type | Common Grades | Typical Surface Finish (Ra) | Surface Characteristics | Post-Processing Options |
|---|---|---|---|---|
| Carbon Steel | 1020, 1045, 4140 | 3.2-6.3 µm (125-250 µin) | Moderate smoothness, prone to oxidation | Machining, shot blasting, painting |
| Stainless Steel | 304, 316, 17-4PH, CF8M | 1.6-3.2 µm (63-125 µin) | Excellent smoothness, corrosion resistant | Passivation, electropolishing, machining |
| Aluminum Alloys | A356, 6061, 7075 | 2.5-5.0 µm (100-200 µin) | Good surface quality, lightweight | Anodizing, machining, chemical conversion |
| Titanium Alloys | Ti-6AI-4V, CP Titanium | 3.2-5.0 µm (125-200 µin) | Good surface, reactive metal | Chemical milling, machining, anodizing |
| Nickel-Based Superalloys | Inconel 718, Hastelloy X | 2.5-5.0 µm (100-200 µin) | Very good surface, heat resistant | Machining, electropolishing |
| Cobalt-Chrome | CoCrMo, Stellite | 1.6-3.2 µm (63-125 µin) | Excellent surface, biocompatible | Polishing, passivation |
| Copper Alloys | C93200 (Bronze), C86300 (Brass) | 2.5-4.0 µm (100-160 µin) | Good surface, decorative potential | Patination, polishing, plating |
| Tool Steel | H13, D2, M2 | 3.2-6.3 µm (125-250 µin) | Moderate surface, very hard | Grinding, EDM, polishing |
| Ductile Iron | 65-45-12, 80-55-06 | 5.0-10.0 µm (200-400 µin) | Rougher surface, good strength | Machining, shot blasting, coating |
| Magnesium Alloys | AZ91D, AM60B | 3.2-6.3 µm (125-250 µin) | Fair surface, very lightweight | Chemical conversion, anodizing |

